

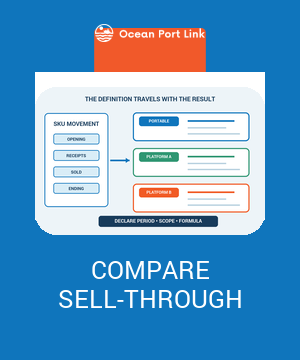
Freeze one sell-through definition before comparing SKUs
Sell-through is useful only when the numerator, denominator, period and inventory scope remain attached to the result. A portable operating view for one imported SKU is:
period sell-through percentage = eligible units sold or shipped during the period / (opening eligible units + eligible receipts released during the period) × 100
Choose either sold, fulfilled or shipped units as the numerator event, document the choice and use it consistently. Count the same variant, unit, location or channel scope in both parts of the calculation. A percentage without those definitions cannot be compared reliably with another report.
Sell-through is a retrospective movement signal. It does not forecast demand, calculate margin, value remaining stock or decide how much to reorder. For an Australian importer with long replenishment lead times, its job is to identify which SKU-period deserves a closer look before the next commitment.
Recognise that platforms calculate different metrics
There is no single platform-independent field called sell-through. Current first-party documentation illustrates the difference.
| Source metric | Numerator | Denominator and period | Interpretation limit |
|---|---|---|---|
| Shopify product sell-through | Quantity sold in the report period | Quantity sold plus ending inventory | Shopify's current report uses the most recent available 30-day period, normally with about a two-day processing delay; quantity sold does not reflect adjustments such as returns, manual adjustments or transfer receipts |
| AWS Supply Chain monthly sell-through | Outbound shipment quantity for the month | Beginning inventory plus inventory received during the month | Requires the declared AWS dataset and monthly scope |
| Amazon FBA sell-through | Units shipped over the past 90 days | Average units on hand over that period | A rolling rate, not the same percentage produced by the first two definitions |
Shopify's inventory-report documentation defines its calculation as quantity sold divided by quantity sold plus ending inventory. The current report uses the most recent available 30-day period, usually with about a two-day processing delay. Shopify also notes that negative ending quantities are treated as zero and that its quantity-sold field does not reflect returns, manual adjustments or transfer receipts.
The AWS Supply Chain user guide defines monthly sell-through using outbound shipments over beginning inventory plus receipts. Amazon's FBA inventory explanation uses shipped units over 90 days divided by average units on hand.
Each can serve its own product and reporting purpose. The error is copying a number from one definition into a threshold or trend built for another.
Declare the SKU, period, location and unit scope
Write a short metric specification before calculating. This prevents the number from changing meaning when data is exported from another channel or a new receipt arrives.
| Definition field | Example declaration | Why it matters |
|---|---|---|
| Product identity | Blue variant, SKU B-42 | A style total can hide size or colour imbalance |
| Period and cutoff | 1–31 August, Sydney close | Aligns movements and ending snapshot |
| Inventory scope | Australian 3PL sellable stock | Excludes stock that the channel cannot fulfil |
| Numerator event | Units fulfilled to customers | Separates orders from actual consumption event |
Also record the base unit. A supplier case, warehouse inner pack and ecommerce each cannot share one denominator until their conversion is controlled. Keep bundles separate unless the calculation expands each bundle sale into its component consumption under the approved recipe.
Decide how cancellations and returns appear. A placed order later cancelled should not be treated as a completed consumption event if the numerator is fulfilled units. A return is not automatically sellable inventory; preserve the platform's reported event and inspect the return or inventory movement separately.
For multi-location or marketplace stock, either calculate one location/channel result or prove that the combined inventory and shipment populations use the same identities and cutoffs. Aggregating a national ending balance with sales from only one channel changes the metric.
Build an inventory movement bridge before trusting the ratio
The denominator is not just an export cell. Reconcile the units that entered and left the declared eligible population:
opening eligible + released receipts + other approved additions - sales event - transfers out - holds or losses = ending eligible
The labels will differ by system, and returns or transfer receipts may sit on either side depending on the declared state. The point is to explain non-sale movements rather than letting them masquerade as customer consumption.
Shopify's analytics-field reference lists inventory units sold separately from adjustment counts, adjustment changes, received quantities and other inventory measures. Use the fields supported by the actual system, but preserve that separation.
If the 3PL, ERP and ecommerce platform disagree at the cutoff, resolve the stock state before interpreting sell-through. A ratio can be mathematically correct against a bad ending balance.
Work a 50% example and expose a shortcut mismatch
Assume one variant begins August with 300 eligible units at the Australian fulfilment location. A further 120 units are received and released into that same eligible pool during the month. The declared numerator is 210 units fulfilled to customers.
| Movement | Units | Running eligible population | Treatment |
|---|---|---|---|
| Opening eligible stock | 300 | 300 | Denominator |
| Released receipts | 120 | 420 | Denominator |
| Fulfilled customer units | 210 | 210 expected remaining | Numerator |
| Non-sale transfer/hold | 12 | 198 observed ending | Explain separately |
Using the portable period definition, sell-through is 210 / (300 + 120) × 100 = 50%.
If sales were the only movement, ending eligible inventory would be 210. Instead, seven units transferred out of the declared scope and five moved to a quality hold, leaving 198 eligible units. A shortcut based on sold plus observed ending would calculate 210 / (210 + 198) × 100 = 51.47%.
That higher percentage does not represent twelve extra customer sales. It reflects a smaller ending eligible pool after non-sale movements. The example does not say Shopify's report is wrong; it shows why its defined fields and caveats must travel with the value, and why a business-created metric needs a movement bridge.
Investigate any unexplained difference before using the number in a purchasing decision. A warehouse transfer may be legitimate, a quality hold may be necessary, or the opening snapshot may be wrong. Sell-through alone cannot choose among those explanations.
Read high and low results without inventing a universal target
A higher value means more of the declared stock population moved through the declared event during that period. It does not automatically mean the SKU is healthy, profitable or ready for a larger order. A lower value does not automatically mean the product should be discounted or discontinued.
| Observed pattern | Possible explanation to test | Next evidence |
|---|---|---|
| High sell-through and repeated stockout days | Demand was constrained by availability | In-stock days, lost-availability periods and replenishment timeline |
| High sell-through with stable availability | Strong movement under current scope | Current runway, lead time and demand baseline |
| Low sell-through after a late-period receipt | Denominator grew before units had time to sell | Receipt release date and comparable cohort period |
| Low sell-through with stable stock and no promotion change | Slow movement may be persistent | Multi-period trend, forecast, returns and product-level investigation |
Use the business's own comparable history and decision context. Product lifecycle, seasonality, promotion, channel mix and supply interruptions can all change interpretation. Avoid borrowing a marketplace rating band for inventory held in a different network or measured with a different formula.
Adjust interpretation for stockouts, launches and receipt timing
A stockout censors observed sales. If the item was unavailable for ten days, the period's fulfilled units do not reveal how many customers would have bought during those days. A high sell-through result may therefore coexist with insufficient supply; a low absolute unit count may coexist with strong demand during the days the item was actually available.
Record in-stock days and material channel outages beside the ratio. Do not “correct” demand by inventing lost sales. Use the availability record to mark the limitation, then address forecasting through a separate method.
New launches and late receipts also need cohort discipline. A shipment released on the twenty-eighth day of a monthly window had only a few days to sell, while opening stock had the full period. Compare consistent launch ages or use a longer, declared horizon rather than treating both populations as equally exposed.
Promotions can accelerate one period without establishing a durable baseline. Record the campaign dates and compare like-for-like periods. Sell-through reports what happened to the eligible stock population; it does not explain whether the effect will repeat.
Keep variants, bundles, channels and returns comparable
Calculate at the level where replenishment and availability decisions occur. A style-level result can look healthy while one size is exhausted and another barely moves. Preserve exact SKU/variant identity and roll up only after the component results remain visible.
For bundles, decide whether the numerator counts parent offers or underlying component units. If the purchasing decision concerns component stock, expand sales using the controlled recipe rather than mixing one bundle order with one each of a component.
For channels, confirm whether stock is shared, allocated or separately fulfilled. Amazon FBA inventory, an Australian 3PL pool and a retail store may have different availability, movement and reporting events. A combined business view is possible only after those scopes are mapped onto one definition.
Returns require the same care. Shopify explicitly notes that its quantity-sold field does not reflect returns in the inventory report. Keep a Shopify result as Shopify defines it, or build a separate net measure with a documented return event and eligible-state rule. Do not silently subtract refunds from one period and add recovered stock to another.
Connect sell-through to imported-inventory decisions
Sell-through tells you how much of a declared population moved. The next decision needs other evidence.
Use weeks of supply to estimate current runway under a declared demand basis. Use the demand-forecasting workflow to construct a forward-looking baseline, then measure forecast accuracy and bias after actual demand arrives.
If slow movement is tying up warehouse space or operating attention, calculate inventory carrying cost separately. Sell-through does not supply the cost inputs or an accounting conclusion.
For imported inventory, compare the review horizon with supplier production, freight, receiving and release lead time. A strong thirty-day result does not by itself justify an order whose replenishment decision commits cash and capacity for several months. Conversely, waiting for a perfect historical sample can leave no time to act. Record the uncertainty instead of asking one ratio to resolve it.
Run a repeatable review and record the next evidence action
Store the formula version beside every result. Include SKU, period, timezone, location/channel scope, base unit, numerator event, opening population, released receipts, ending snapshot, non-sale movements, stockout days, material promotion or launch note, result, reviewer and next evidence action.
Review comparable periods on a consistent cadence. When the definition changes, keep the old series or restate it transparently; do not splice two formulas into one trend line.
The output should be a question for the next control, not an automatic command. A high result may trigger a runway and lead-time review. A low result may trigger a cohort, availability, returns or product investigation. An unexplained movement bridge triggers data reconciliation first.
That is the practical value of sell-through for an importer: a consistent way to spot where inventory movement deserves attention, while leaving forecasting, purchasing, cost and commercial decisions to the evidence designed for them.
Sources


.png)
